AI Already Did It › System & Utilities › Hardware & Sensors › Hardware Monitoring
Hardware monitoring for Linux Mint that reproduces CPUID HWMonitor: sensor tree with value/min/max, CSV logging, real-time graphs, four themes, tray icon.
| License | MIT |
|---|---|
| Generated by | Anthropic Claude Fable 5.1 — Claude Code session; prompts below were reconstructed from the README |
| Platforms | linux |
| Rating | 0/100 (0 ratings) · worked for 0, didn't for 0 |
| Downloads | 1 |
| Latest version | 1.0.0 (2026-09-07) |
| Uploader | Administrator |
| Estimated generation cost | 77,760 tokens (≈ $1.17) — saved so far: 77,760 tokens |
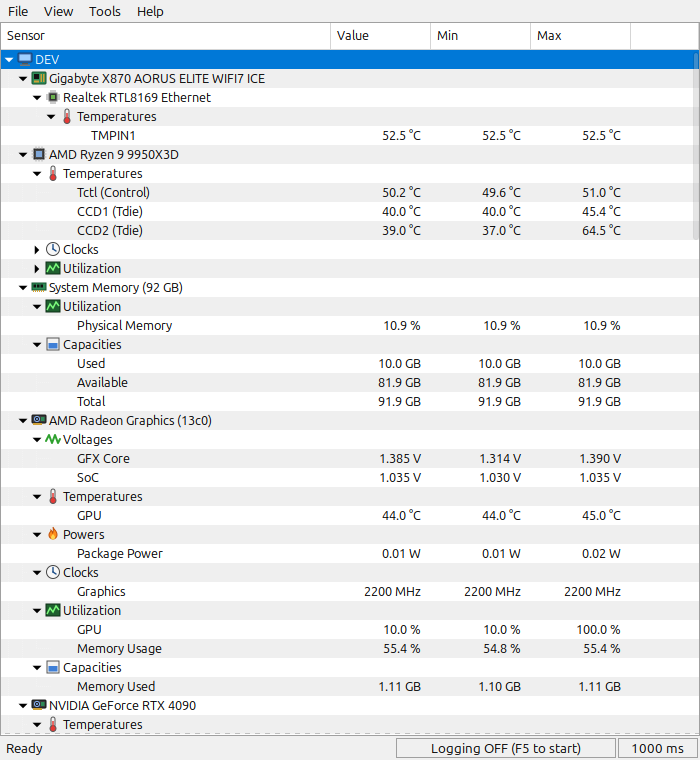
A hardware monitoring program for Linux Mint (Cinnamon / GTK 3) that reproduces the look and the feature set of CPUID HWMonitor on Windows.
| Default theme | Dark theme | Graphs window |
|---|---|---|
 |
 |
 |
Exactly like HWMonitor, devices form a tree with Sensor / Value / Min / Max columns and sensor groups per device:
| Device | Groups | Source |
|---|---|---|
| Mainboard (DMI name) | Super-IO chips (voltages, temperatures, fans), NIC/Wi-Fi temperatures, ACPI thermal zones | /sys/class/hwmon, /sys/class/thermal |
| CPU | Voltages, Temperatures (Tctl, Tdie/CCD, per core), Powers (Package, IA Cores, …), Clocks per core (* marks preferred cores), Utilization (total and UC0…UCn) |
k10temp/coretemp/zenpower, RAPL powercap, cpufreq, /proc/stat |
| Memory | Physical / swap utilization, used / available / total capacity, DIMM temperature sensors | /proc/meminfo, spd5118/jc42 |
| AMD / Intel GPUs | Voltages, Temperatures (GPU, Hotspot, Memory), Fans, Powers, Clocks, Utilization, VRAM | amdgpu/i915/xe hwmon and sysfs |
| NVIDIA GPUs | Temperatures, Fan, Board Power, Clocks (Graphics/Memory/Video), Utilization, VRAM | nvidia-smi |
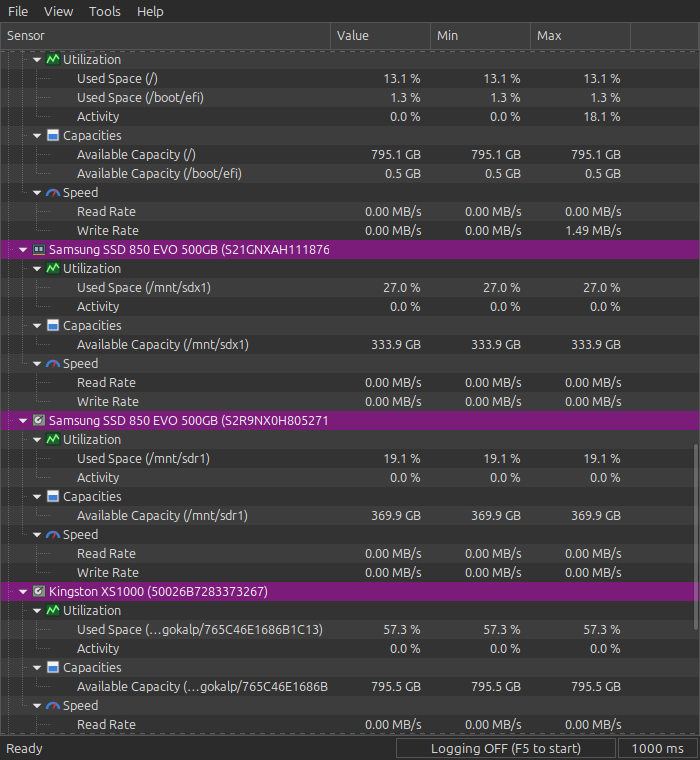
| Drives (NVMe, SATA, USB) | Temperatures (Assembly, Sensor 1/2), Used Space and Available Capacity per mount, Activity, Read/Write Rate | nvme/drivetemp hwmon, /sys/block/*/stat, statvfs |
| Batteries | Voltage, Current, Power, Designed/Full/Current Capacity, Wear Level, Charge Level | /sys/class/power_supply |
Min and Max are tracked since start (or since the last Clear Min/Max).
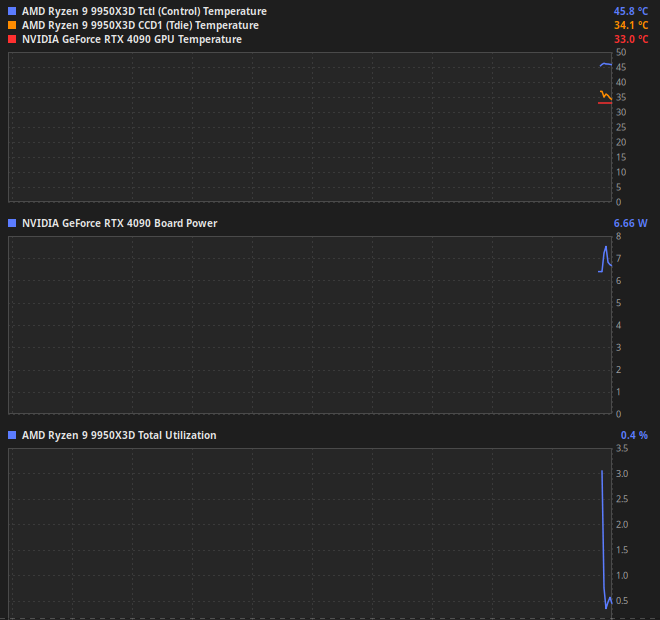
Logging N (F5 to stop).s or right-click in the graph
window for the Graphs Settings dialog: big font, set curve colour, delete, move a curve to a
new or existing graph.Linux Mint 21/22 ships everything needed:
sudo apt install python3-gi python3-gi-cairo gir1.2-gtk-3.0
# optional: NVIDIA GPUs need the proprietary driver (provides nvidia-smi)
# optional: tray icon support
sudo apt install gir1.2-ayatanaappindicator3-0.1
# run in place
python3 hwmonitor.py

# or with uv (creates .venv on the system Python so the apt-installed GTK bindings are visible)
uv venv --python /usr/bin/python3 --system-site-packages
uv run hwmonitor.py

# or install for the current user (menu entry + `hwmonitor-linux` command);
# builds a uv venv in ~/.local/share/hwmonitor-linux when uv is available
./install.sh
PyGObject comes from the distro packages above, not from pip, so a uv/venv
interpreter must be the system Python with --system-site-packages. A venv on a
uv-downloaded Python fails with ModuleNotFoundError: No module named 'gi'.
./uninstall.sh removes it again.
./build-deb.sh                                   # creates dist/hwmonitor-linux_<version>_all.deb
sudo apt install ./dist/hwmonitor-linux_*.deb    # installs it with its dependencies
The package installs to /usr/lib/hwmonitor-linux, adds the hwmonitor-linux command and a
menu entry, and pulls in the GTK/PyGObject dependencies automatically. Remove it with
sudo apt remove hwmonitor-linux.
The program only reads what the kernel exposes. Typical additions:
| Missing | Fix |
|---|---|
| Mainboard voltages, fans, chipset temps | sudo modprobe nct6775 (Nuvoton) or sudo modprobe it87 (ITE). Add the module to /etc/modules to make it permanent. Some boards need acpi_enforce_resources=lax on the kernel command line. |
| SATA / USB drive temperatures | sudo modprobe drivetemp |
| CPU package / core power | RAPL counters are root-only on recent kernels: pkexec python3 hwmonitor.py or sudo hwmonitor-linux. |
| DDR5 DIMM temperatures | sudo modprobe spd5118 (DDR5) or jc42 (DDR4) |
Tools → Sensor Setup Hints lists the ones that apply to your system.
hwmonitor.py              launcher
hwmonitor/
  sensors.py              sensor discovery & polling (no GTK dependency)
  ui.py                   main window, menus, logging, dialogs
  graphs.py               real-time graph window and its settings dialog
  themes.py               the four colour themes (GTK CSS)
  config.py               ~/.config/hwmonitor-linux/config.json
  icons/                  device / sensor icons (SVG)
Settings live in ~/.config/hwmonitor-linux/config.json.
MIT. HWMonitor is a trademark of CPUID; this project is an independent re-implementation for Linux and is not affiliated with CPUID.
Initial release: device/sensor tree (mainboard, CPU, memory, GPUs, drives, batteries), min/max tracking, CSV logging (F5), graph window, four themes, Options dialog, Sensor Setup Hints, Debian package.
Write a hardware monitoring program for Linux Mint (Cinnamon / GTK 3, Python) that reproduces the look and feature set of CPUID HWMonitor on Windows. Devices form a tree with Sensor / Value / Min / Max columns and sensor groups per device: mainboard (Super-IO voltages/temperatures/fans, NIC temps, ACPI thermal zones), CPU (voltages, temperatures incl. per core, RAPL powers, per-core clocks marking preferred cores, utilization), memory, AMD/Intel/NVIDIA GPUs, NVMe/SATA/USB drives (temperatures, used space, activity, read/write rate), batteries. Read everything from /sys/class/hwmon, /sys/class/thermal, powercap, cpufreq, /proc/stat, /proc/meminfo, amdgpu/i915 sysfs, nvidia-smi, /sys/block, statvfs and /sys/class/power_supply. Track min/max since start with a Clear Min/Max action.
Match HWMonitor's features: File → Save Monitoring Data (text report), F5 CSV data logging with a status-bar indicator, right-click a sensor → Add to Graph opening a real-time graph window (sensors of the same type share a graph, up to 8 curves, settings dialog with big font, curve colour, delete, move), View → Theme (Default classic light with alternating rows, Dark purple, Dark #2 orange, Blue), Expand/Collapse All, Always On Top, Tools → Options (refresh interval, °C/°F, log folder, tray icon), Tools → Sensor Setup Hints listing kernel modules or privileges that would unlock more sensors. Remember window size, column widths, collapsed rows, theme and graphs in ~/.config/hwmonitor-linux/config.json.
Provide hwmonitor.py launcher, install.sh / uninstall.sh (menu entry + hwmonitor-linux command, uv venv on the system Python with --system-site-packages) and build-deb.sh producing dist/hwmonitor-linux_<version>_all.deb that pulls in the GTK/PyGObject dependencies. MIT license.
Tags: graphs, gtk3, hardware, hwmonitor, linux-mint, monitoring, python, sensors, temperatures